GDP growth and poverty decline in Ethiopia: Who owns the numbers?
Hone Mandefro and Morten Jerven
A recent report by the World Bank (WB) declared that poverty in Ethiopia is down by 33% since 2000. It attributed the reduction to agricultural growth investments in basic services and effective safety net. “The pace of poverty reduction in Ethiopia has been impressive, especially when compared with other African countries; only Uganda has had higher annual poverty reduction during the same period,” the Bank said in a statement.
However, in Ethiopia the last two decades have been periods of intense controversy over national statistics. The controversy surfaced at different levels and engaged people from different walks of life, from ordinary people to parliamentarians.
This controversy concerns the statistics produced by the Central Statistics Authority (CSA) often showing double-digit economic growth and a very rapid decline in poverty – almost half of the prevalence before two decades. However, alternative GDP and poverty statistics produced by other international organizations contest the government’s data. Thus, depending on the source of data, one can find different narratives of GDP growth and poverty prevalence in Ethiopia.
GDP statistics
According to official statistics, Ethiopia has continued to register double-digit economic growth. (Please see the following graph).
Graph 1- Official government growth rate
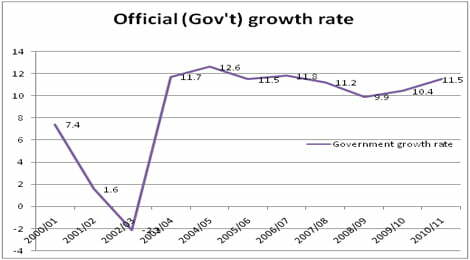
Source: compiled from Ethiopian Government reports of various years
Whereas the official numbers have been quoted in double digits for the past decade, estimates by the International Monetary Fund (IMF) and various academic researchers consistently show a lower GDP Growth rate. For instance, in its October 2013 Article IV Consultation report, IMF notes that: “GDP statistics in Ethiopia are subject to significant weaknesses. Applying plausible factor productivities would suggest that the annual GDP growth rate could be off by as much as 3 percentage points in recent years”. Similarly, in October 2014, the IMF consultation report concluded that IMF’s GDP growth “projections incorporate a downward adjustment from official figures to take into account the uncertainty around the underlying growth rate due to weaknesses in the national account statistics.” It further said that “the authorities’ projections are more optimistic (in the 11.0 –11.4 percent range)”. Besides, a thorough analysis by prominent economists, Alemayehu Geda and Addis Yimer, suggest that the actual growth rates between 2000 and 2013 were around 5 to 6 percent per annum. With such doubts over the correct GDP growth rate, the main problem is that many are not certain about which pace the Ethiopian economy is growing.
Poverty statistics
Unfortunately, following the 1987 famine, Ethiopia has been an iconic image for poverty. What has happened to poverty in Ethiopia since then? The answer depends on the index one uses. The government poverty data, which comes from the four rounds of Ethiopian Household Income and Consumption Expenditure Survey (HICES), presents rapid decline in poverty. Accordingly, poverty head count have declined from 45% in 1996 to 29% in 2010 and estimated to have further went down to 26 % in 2013 (according to the budget speech of Sufian Ahmed, the Minster for the Ministry of Finance and Economic Development – MoFED).
However, the poverty survey of the government has been criticized on a number of grounds. Some academicians argue that it covered only sedentary areas and excludes nine zones inhabited by non-sedentary populations in Afar and Somali regions, where poverty is more prevalent than other regions.
In a paper entitled, “Is poverty really falling in rural Ethiopia?” Stephen Devereux and his collogues argue that: “the original sampling frame [for the 1999/2000 HICES] was too small and unrepresentative to provide a basis for extrapolating national poverty levels or trends” in Ethiopia. Still for others, the poverty line at 1,075 birr (About US$ 50 in today’s exchange rate) in the first round, and has been indexed to inflation since then, is set at very low.
Others blame the gap for problems with indexing the poverty line to inflation. For instance in their 2005 study of the effect of inflation on poverty estimates, Tesfaye Gebremedhin and Stephen Whelan concluded that since inflation varies significantly among regions “the use of a country level Consumer Price Index (CPI), which does not account for spatial cost of living differences, gives incorrect poverty estimates”.
The last set of criticisms of the poverty statistics comes from qualitative poverty studies that portray increasing poverty. In their assessment of poverty situation in Ethiopia for the World Bank Voices of the Poor report Deslagen Rahmato and Aklilu Kidanu concluded that in the ten years between 1989 and 1999, “a lot of households have moved from the middle to the lowest category and a new category of the weak and disabled has been added [to the category of poor]”. This view is reaffirmed in a more recent qualitative study by Yonas Alem and his collogues which concluded that “subjective poverty remains high; the share of households that perceive themselves as poor has barely changed at all between 1994 and 2009”.
In a way that supports the view of critics, if one looks in to the multidimensional poverty index (MPI) for Ethiopia, poverty seems widespread and severe with only marginal decline in the last two decades. The MPI is a global estimate of multidimensional poverty in developing countries by the Oxford Poverty and Human Development Initiative (OPHI). It measures aspect of deprivation people experience at the same time using three dimensions and ten indicators: two for heath (nutrition and child mortality), two for education (years of schooling and child attendance), and six for living standards (access to electricity, safe drinking water, quality of house, cooking fuel type, and asset ownership). The data for these indicators come from Demographic and Health Surveys (DHS) of each country.
Table 2: MPI in Ethiopia
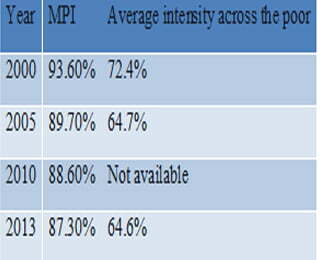
Of course, MPI has also been criticized at least on two grounds. First, the cut-off point for poverty status in MPI (set at one third of the ten indicators) is not only a normative judgment that one can contest, but also, “does not resolve the more fundamental issue of how the dimensions and cut-offs should be chosen” in measuring poverty, writes Andrew Fisher of the International Institute of Social Studies. To what extent the cut-off point or the composition of the indictors in Ethiopian context is realistic can be contested. Martin Ravallion, the former director of research department at the World Bank, argues that if the interest of the MPI score, as its name portrays, is to know poverty in its multi-dimensions what we need is the poverty situation of individuals in each dimension instead of the aggregated score or percentage as reported in the Multidimensional poverty reports.
Poverty estimates obviously depends on how poverty is defined. However, the discrepancy in Ethiopia is too large to leave it for difference in accounting methods. Ethiopia has a fair level of statistical capacity than most sub-Saharan African countries. Arguably, funding and priority given to the statistics authority is less than one would wish. However, the pressing need is for political independence than shortage of funding. The Central Statistics Authority is accountable for the Ministry of Finance and Economic Development, and its lack of independence from the executive is the major source of lack of trust.
Politics by numbers: statistics as (de)legitimatizing tool
Variation in estimates of poverty and growth are common for every country but not in such wide discrepancy as for Ethiopia. How does such contradiction in statistics feed in to politics in Ethiopia? A recent study, which analyzed trends of statistics usage among Ethiopian actors* found out that users were faced with wide discrepancy between the reality and estimates and the increasing tendency of political actors to pick the numbers that supported their own narratives. Meanwhile, the government sticks to its own data, and is not responding to reports that depict a different account – such as the MPI annual reports. However, it is, more often than not, content to use statistics coming from international organizations and news outlets if and when they confirm to its own narrative of a rapidly growing Ethiopia with declining poverty.
The Central Statistics Authority of Ethiopia is accountable for the Ministry of Finance and Economic Development. This poses a problem for opposition groups, for example, as they do not have direct access to state controlled statistics authority; they often express concerns that the statistics that comes from CSA is unreliable and fabricated. And claim that fabricated statistics are used to color the ruling party’s discourse of a rapidly growing Ethiopia.
Graph 2: MPI estimate versus government’s poverty estimate
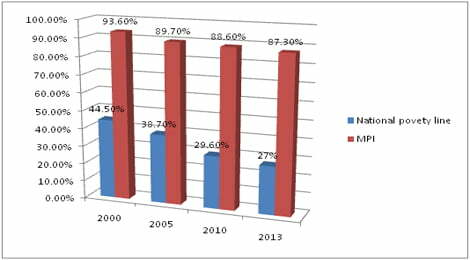
Source: Compiled from MPI reports and government poverty survey reports
Fenote Nesanet, an Amharic weekly owned and run by the now troubled Unity for Democracy and Justice (UDJ) party published in 2012 that: “If we have to believe statistical reports, the government should refrain from interfering in the works of institutions that produce such reports and should ensure the autonomy of these institutions. However, what is being done now is very clear – torture the data until it confesses”. There are many examples of this in the public sphere, too. Alemayehu Gebremariam, an American based lawyer known for his fierce criticism of the government in Ethiopia, wrote in 2010 that: “the bottom line on the regime’s statistical claims… is that the figures are cooked up in the Central Statistics Office … This is the extent of the economic statistical game that continues to be played before our eyes”.
Symptoms of politicizing statistics
These incidents show that statistics is being politicized in Ethiopia. First, in this controversy, two coalitions are dominating the discourse. One group includes the ruling party and its supporters who propagate the government’s data. The other coalition consists of opposition parties and scholars that propagate statistics that undermine the government’s narrative. Such arrangements of actors and antagonisms between the two groups suggest that these two coalitions did not emerge out of the debate on statistics but were pre-existing groups that are contesting for power using statistics to advance their views.
Second, the content of the debate on the controversy is the “correct” number of poor people. There is no indication that the controversy is caused by differences in conceptualization of poverty. The selection of numbers is understandable given “numbers provide a unique means with which to simplify and communicate complex social phenomena” such as poverty, writes Liam Clegg in 2009. Through numbers, each party tries to make their story accessible to the ordinary public who lack both the time and expertise to understand the complex process involved in knowing the trends of poverty in the country.
Thus, in Ethiopia numbers are becoming tools for, and manifestation of, ongoing power struggle. The ruling party justifies its prolonged rule claiming that it is reducing poverty and bringing development in Ethiopia. Arguably, the importance of showing high growth and rapid decrease in poverty to legitimatize itself has increased especially since 2005. On the other hand, the opposition camp and critics of the system reject these numbers out of hand. What suffers in this process is the genuine attempt to have objective understanding of what happens to the living standards of ordinary Ethiopians.
Even for its generous estimates, the World Bank cautions that of the +90 millions Ethiopians, “37 million Ethiopians remain either poor or vulnerable to falling into poverty in the wake of a shock.” It also admits that “the very poorest in Ethiopia have become even poorer. ”
Ed’s Note: Hone Mandefro is Lecturer of Development studies and Social Work and Director of the Community Services Directorate at University of Gondar. *He has recently completed master’s thesis on “Politics by numbers: Poverty Reduction Discourse, Contestations and regime Legitimacy in Ethiopia”
Morten Jerven is Associate Professor at the Simon Fraser University, School for International Studies. His book Poor Numbers: how we are misled by African development statistics and what to do about it was published by Cornell University Press in 2013. Jerven’s fourth book, Africa: Why Economists Get It Wrong will be published in May 2015.