Rush for the exits: Why is Ethiopia’s capital flight accelerating?
Ayele Gelan (PhD), Special to Addis Standard
A substantial sum of money has been illegally flowing out of Ethiopia during the last decade. What is even more worrying is not just that the levels of out flows are high but also the sizes of illicit capital outflows have been rising at alarming rates. This rather unique pattern has attracted the attention of the general public as well as those of bilateral and multilateral donor agencies.
I will also attempt to put some flesh on the bones of facts presented in the GFI database. I will do so by shedding some light on the political economy context of the illicit capital outflow (IFFs) from Ethiopia.
Stolen money trails
The natural starting point is to get a sense of magnitude on the levels and trends. The GFI data is summarized and plotted in Fig. 1. For the time being we focus on the total flows, that is the heights of each bar denoting sizes of annual illicit money outflows. The sum of the blue and red colors gives total amount of money illegally moved aboard from Ethiopia during that year. This ranged from USD $0.4 billion in 2004 to USD $5.6 billion in 2010.
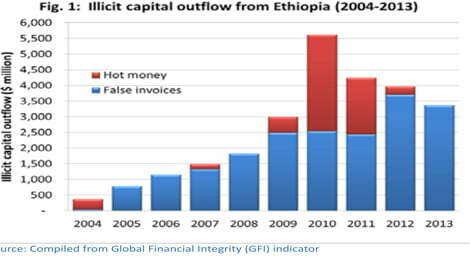
The average annual outflow was $2.6 billion during 2004 and 2013. This is a sizeable sum of money by any standard. For instance, according to estimates reported by the World Bank, the amount of official development assistant (ODA) Ethiopia received in 2010 was $4 billion but total amount of IFFs during that year was $5.6 billion.
This means in 2010 alone Ethiopia’s IFFs exceeded the ODA it received that year by $1.6 billion. In other words, Ethiopia’s IFFs amounted to diverting the entire aid money of 2010 to foreign banks and then still transfer abroad an additional sum of money.
During the entire period (2004 to 2013) the total amount of money that Ethiopia lost due to IFF was $26 billion. This amounts to stealing nearly $300 per citizen. Alternatively, the size of stolen money was about 11 times the total the amount of emergency aid being sought from donors in the current year to buy cereals from abroad and feed the drought victims.
Potential culprits
One may wonder – who are the culprits responsible for Ethiopia’seconomic fraud at such massive scale? The GFI categorizes possible perpetrators into three groups: (a) financial institutions; (b) complicit business counterparts, mainly importers and exporters; and (c) government officials.
In the Ethiopian case, it is reasonable to exclude financial institutions because there is no foreign bank operating in Ethiopia, and the domestic private banks are extremely tightly controlled. Ethiopia’s most influential banks, the Commercial Bank of Ethiopia (CBE) and the National Bank of Ethiopia (NBE), are owned and run by the government. Therefore, in the context of Ethiopia it is safe to include (a) under (c).
That is to say Ethiopia’s IFF can only be undertaken by importers, exporters or government officials. One would hasten to add that there is a huge extent of overlaps between government officials and big businesses in Ethiopia, since big businesses are highly interconnected with the government and/or they are directly or indirectly owned and run by government officials.
Money diversion channels
Now we can shift our attention back to fig. 1 and consider the breakdowns of the IFFs, the individual component denoted by the blue and red sections in each bar. The GFI applies a methodological framework that accounts for two types of illegal movements of money from one country to another.
The first one is export or import trade misinvoicing. This is measured by using a methodology called Gross Excluding Reversals (GER). This simply mirrors exports by one country with imports of another country and vice versa. For instance, items of imports recorded by Ethiopia should agree with records of exporters to Ethiopia in all aspects – value, quantity and quality.
The second one is various leakages in the balance of payments, measured by using the “hot money narrow” (HMN) approach.The latter one is often referred to as “net errors and omissions” in the balance of payment jargon. For instance, if a donor agency or country recorded $1 million grants to Ethiopia but this does not appear in the records by the authorities in Ethiopia, then the GFI records this as a leakage from Ethiopia’s balance of payment.
It is clear from Fig. 1 that the bulk of illicit money transfer from Ethiopia has taken place using trade misinvoicing, denoted by the blue component of the bar. In 2004, trade misinvoicing constituted only 14% of the total IFFs. In 2013, however, this proportion has grown to 100%, the entire IFFs began to be accounted for more and more by trade misinvoicing. For the entire period under discussion, $19.7 billion (or 76% of the total IFFs) was conducted through trade misinvoicing. The year 2010 is an exception – diversion of “hot money” dominated in that year; it constituted 55% of the total IFFs.
False invoices
Trade misinvoicing can take place in one of the following four ways: over invoicing exports, under invoicing exports, over invoicing imports and under invoicing imports. In Ethiopia’s case, the GFI report indicated import over-invoicing is by far the most important method of transferring money abroad. During the period under analysis, about $19.7 billion was transferred abroad through import over-invoicing.
It is critical to understand how import misinvoicing hurts the Ethiopian economy. This is important in the context of huge public construction projects with substantially large components of imports of machinery and other equipment. For instance, an acquisition of a set of machinery whose real value is $1 million is recorded with inflated invoice of $1.5 million.
The importer allocates project budget at the inflated import value, pays the real value to the supplier and then siphons-off the difference (in this case $0.5 million) and deposits it in a foreign bank account. The real damage to the economy happens in terms of inflated capital expenditure. Perhaps the opportunity large capital projects provide for corrupt officials could be the ulterior motive for the uncontrollable urge to attach such a high priority to large capital projects in economic development strategies.
However, it should be noted that public capital projects are often financed through commercial loans that should be paid back with cumulative interests in years to come. The economic return to capital project would partly depend on the cost consideration at project implementation stage.
The GFI also finds some export trade misinvoicing in Ethiopia’s foreign trade, over-invoicing by $6.5 billion as well as $3 million under-invoicing. In trade based money laundering, the most common types of misinvoicing are import over-invoicing and export under-invoicing. As noted above, the case of import invoicing has no complications – so much over invoicing has taken place and it explains the bulk of trade based money laundering in Ethiopia. However, the case of export over-invoicing is uncommon.
Export over-invoicing do happen although they are rare, e.g. China’s trade with Hong-Kong. Export over-invoicing is required when there is a need to plough back money from abroad and report it as inflated foreign direct investment. This is likely the case with Ethiopia where the authorities have been desperate to report higher foreign investments particularly in the first half of the period under analysis.
Ethiopia’s capital flights dwarfs rest of developing countries
It would prove useful to know how bad Ethiopia’s IFFs is relative to other countries. Fig. 2 below compares Ethiopia with its neighbors, the rest of Sub-Saharan Africa (SSA) as well as the average of developing countries (DCs). The comparison was done by expressing total illicit money outflowas percentage of GDP. The years are grouped into three intervals. For reasons discussed further below, it would prove useful to contrast pre- and post-2005. Accordingly, I have isolated 2004 and then divided the remaining years into two equal intervals.
This revealed astonishing patterns of illicit money outflow from Ethiopia which starkly contrasted with those for other countries. First, throughout the years Ethiopia’s records considerably exceeded those for its two immediate neighbors, Kenya and Tanzania. Second, a comparison of 2004 across the countries shows that Ethiopia’s illicit money outflow was way below the Uganda, SSA, and the DCs averages.
Third, the situation changed dramatically from 2005 onwards. Ethiopia outstripped Uganda, and then closed the gap with the SSA average. Fourth, Ethiopia’s average annual money outflows between 2010 and 2013 reached 11% of the country’s GDP, considerably exceeding the corresponding figures for the other countries – SSA (5%), DCs (4%), Uganda and Tanzania (2%) and Kenya (0.013%). Fifth, it is important to note that illicit money transfers abroad constituted smaller and smaller percentages of GDP for most countries over the years, implying substantial improvements in transparency in their economic management. The situation in Ethiopia sharply contrasts with this reality – illicit money outflow becoming a larger and larger percentage of Ethiopia’s GDP. This indicates transparency in Ethiopia’s economic management has gone from bad to worse over the years.
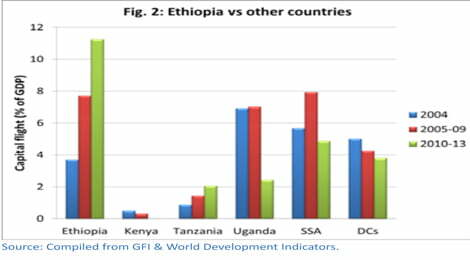
It should be noted that the SSA average is largely driven by money being squandered by oil and other mineral resources exporting countries such as Nigeria and Angola. It is telling to note that Ethiopia, a country not known for exporting substantial mineral resources, is now characterized by illicit money outflow to GDP ratio exceeding that of an average SSA country.
Blind spots in accounting for remittance flows
The analysis in the preceding sections relied entirely on the Global Financial Integrity (GFI) report. GFI methodology is strictly confined to official records as starting points and then mirrors records at different places and times. Systemic discrepancies between records are then registered as illicit transactions.
Clearly, then the GFI methodology does not account for illicit money flows that take place through financial transactions in informal or black markets. Remittance flows are riddled with black markets in hard currencies. The situation is even worse in the context of Ethiopia, where official hard currency flows are tightly controlled, and hence creating conditions for prevalence of underground currency transactions.
To the extent that remittances are channeled through formal banking or foreign exchange offices, then the transactions get into the balance of payment records. Leakages from the flow are accounted for through the GFI approach called “hot money” discussed earlier.
However, there are strong evidences indicating that the bulk of remittance transfers to Ethiopia actually happen through informal channels, mainly because of better rates and lower costs.
The informal channels may take one of two forms. First, it is common for Ethiopians living abroad to take hard currencies with them every time they visit home and then directly exchange it to birr in local black markets at better rates by avoiding transfer fees. It also happens that they send hard currencies via travellers they trust so that they give it to their relatives, who in turn get it converted in local black markets. The World Bank estimated that 14% of Ethiopians to whom money was transferred from abroad in 2010 got it through travelers. Since the World Bank has not made a reference to money converted at local black markets, it means the total amount of hard currencies entering Ethiopia by informal channels is much higher than the 14% who regularly receive remittances.
Additionally, there is a more sophisticated black market which operates pretty much like the way foreign money transfer services operate, except that these are operated informally by individuals living abroad. As any Ethiopian living abroad can tell, every big city countries with hard currencies has a few black market operators who offer exchanges of foreign currencies to birr with additional incentives,at least two or three birr on top of the going rate that money transfer agencies offer.
I selected a couple of major cities and gathered background information for this piece. The margins offered vary across time and space but the current margin on above Western Union conversion rates were at least one birr per unit of USD equivalents of local currencies in London, Dubai, and Kuwait, excluding foreign exchange office fees charged per transaction. This means Ethiopians living abroad have good enough incentive to look for black market operators rather than sending money through formal channels.
The role of the black market is simply to collect and bulk the hard currencies. Where exactly the collected money goes is anybody’s guess. One may hope that importers who face constraints in foreign exchange rationing may smuggle out the hard currency they collected and/or importers may assign agents in foreign countries to collect and bulk hard currencies for them.
In both cases importers may spend the money they bulked on purchasing goods and services that will eventually enter Ethiopia. This is an optimistic scenario since the country may eventually benefit from availability of goods and services in the domestic market, except that the transactions were done informally and the government might have lost some tax revenues.
The upshot of this discussion, however, is that the hard currencies collected from local black markets may get smuggled out and get deposited in foreign bank accounts. Similarly, black market operators residing abroad may also be primarily motivated by a pressing need to convert birr into a hard currency and safely deposit it in a foreign bank account.
It should be noted that the GFI methodology misses out such blind spots in remittance flow accounting, which means Ethiopia’s capital flights discussed in the preceding sections is highly likely to underestimate the size of illicit capital flights from Ethiopia. If so much has been done to move money illegally abroad by abusing formal channels, then it is realistic to assume that the informal channels are even more susceptible to abuses by the same group of actors who seem to be in a rush to the exits.
Why the rush?
At this juncture it is appropriate to pool together different lines of discussions in the preceding paragraphs. The most crucial point here is the timing of dramatic changes in Ethiopia’s capital flight. It is clear from the facts presented in this piece that 2005 was a watershed moment in Ethiopia’s capital flight history in recent years.
For those who closely follow Ethiopia’s political and economic affairs, the fact that dramatic things began to happen soon after 2005 does not come as a surprise. The general election of that year and the upheavals that followed had seriously shaken self-confidence among the elites who held political and economic power. The possibility of losing power and economic advantages that accrues from it began to be felt starting from that year, when the ruling EPRDF snatched power under murky conditions from the hand of the opposition who claimed they actually won the general election.
This argument is substantiated by the following logical reasoning established in our discussions earlier. In the Ethiopian context there are no foreign banks, and domestic banks are very tightly controlled by the government. Also, there is a great deal of overlaps between interests of big businesses and those of government officials.
In that case, corrupt government officials and their affiliated businesses are the likely culprits for capital flights from Ethiopia at such epic proportions. The fact that rampant corruption has crippled the current government is openly debated in local media and among the elite at official forums. The evidence provided in this piece only corroborates the ongoing public debate. AS
ED’s Note: Ayele Gelan is an economist by training. He can be reached at augelana@gmail.com. He tweets @AyeleGelan